Episode
Bonus: Visualising the Workflow
Questions
- How can I see the dependencies between my rules?
- What is a Directed Acyclic Graph (DAG)?
- How do I preview what Snakemake intends to do?
Objectives
- Use the
--dagflag to generate a visualization of the analysis. - Understand the difference between the Rule Graph and the File Graph.
- Use dry-runs (
-n) to verify the execution plan.
Getting the Big Picture
As your analysis grows from 2 rules to 20, and from 3 samples to 300, it becomes impossible to keep the entire workflow in your head. Snakemake provides built-in tools to “draw” your analysis for you.
The Directed Acyclic Graph (DAG)
Snakemake represents your workflow as a DAG:
- Directed: There is a clear flow from raw data to final plots.
- Acyclic: There are no loops (you can’t have a file that depends on its own output).
- Graph: A mathematical structure of nodes (rules/files) and edges (dependencies).
Generating the DAG
To create a visualisation,
we tell Snakemake to generate the DAG in a format called dot,
and then we use the graphviz tool to turn it into an image.
First, we need to install it:
pixi add graphvizRun the tool:
pixi run snakemake --dag | dot -Tpng > dag.png
# pixi run snakemake --dag | dot -Tpdf > dag.pdf   ### For PDF format
How to read the DAG:
- Nodes (Boxes): Represent the jobs that need to be run.
- Arrows: Represent the flow of data.
- Solid vs. Dashed lines: In many viewers, a dashed border indicates that the file already exists and the job doesn’t need to run.
Ensure you have the Snakefile from the previous episode with Run the DAG command: It has been reported that the command above may not work due to differences in how or you can run: Look at your DAG.
If you were to run this on a machine with only 1 core, how many steps would it take?
If you had 4 cores, how would the timing change?Visualizing our Scaled Workflow
DYJets,
TTbar, and Data. If you also completed the optional WJets challenge,
your DAG will contain one additional branch.pixi run snakemake --dag | dot -Tpng > dag.pngdot is handled.
If you encounter issues, try the following command instead:pixi run snakemake --dag | pixi run dot -Tpng > dag.pngpixi run dot -C
pixi run snakemake --dag | pixi run dot -Tpng > dag.pngdag.png, it should look like the following image.
Notice how the branches for each dataset are parallel.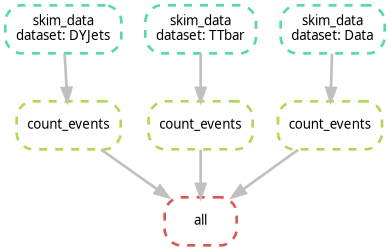
Identifying the Bottleneck
Show solution
select_events jobs at
the same time, which reduces the total wall-clock time before the final gather
step runs.
This is the power of a DAG-based system!
If you have 1,000 samples, the --dag command will produce a giant PDF with 1,000 boxes,
which is unreadable.
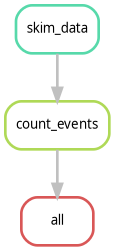
To see a simplified version that only shows how the rules connect (ignoring the individual samples), use:
pixi run snakemake --rulegraph | dot -Tpng > rulegraph.pngThis is often much more useful for complex CMS analyses to ensure the logic is correct.
The Dry-Run: “Look Before You Leap”
Before you submit 1,000 jobs to a cluster, you should always perform a Dry-Run. This tells Snakemake to calculate the DAG and print the execution plan without actually running any commands.
pixi run snakemake -nIf you want more detail (like seeing the actual shell commands that will be executed), use:
pixi run snakemake -n -pDid the previous command work?
If you run these commands on top of finished workflow, you should see something like:
Building DAG of jobs...
Nothing to be done (all requested files are present and up to date).
This is expected because all the output files already exist. If you change something in your Snakefile (like adding a new rule or changing an existing one), the dry-run will show you which jobs need to be re-run.
Alternatively, if you want to see the dry-run or the commands to execute, use:
pixi run snakemake -n -p --forceallKey Points
- DAG: A visual map of your analysis dependencies.
- Dry-run (-n): Always perform a dry-run to verify the plan before executing.
- Rule Graph: A simplified visualization showing the relationship between rules rather than individual files.